Retail endcaps will become more strategic in 2026. They will do more than fill empty space at aisle ends. The strongest Endcap Displays will connect seasonal demand, shopper behavior, and measurable store performance. Retail teams are expected to favor modular fixtures, clear pricing, and product stories that can change quickly. Digital screens may support these displays, but technology alone will not create better sales. Placement still matters. So does visibility.
This guide examines the leading endcap formats expected across grocery, beauty, home, and general merchandise stores. It considers practical evidence from retail testing, visual merchandising practice, and reported shopper preferences. Compact displays may help smaller stores use limited floor space more effectively. Sustainable materials could also become more important, especially when fixtures are reused across campaigns. However, sustainability claims should be verified through supplier documentation, not attractive packaging alone.
Some predictions may prove wrong. Consumer habits can shift quickly. That uncertainty matters. A display that performs well in one region may fail in another because traffic patterns, pricing, and local demand differ. Retailers should test sign placement, product height, lighting, and replenishment time before expanding a design nationwide. Small details count, such as keeping popular items within easy reach and avoiding cluttered shelves. The most effective Endcap Displays will likely balance visual impact with operational discipline. They should attract attention, support informed choices, and make store execution easier for staff.
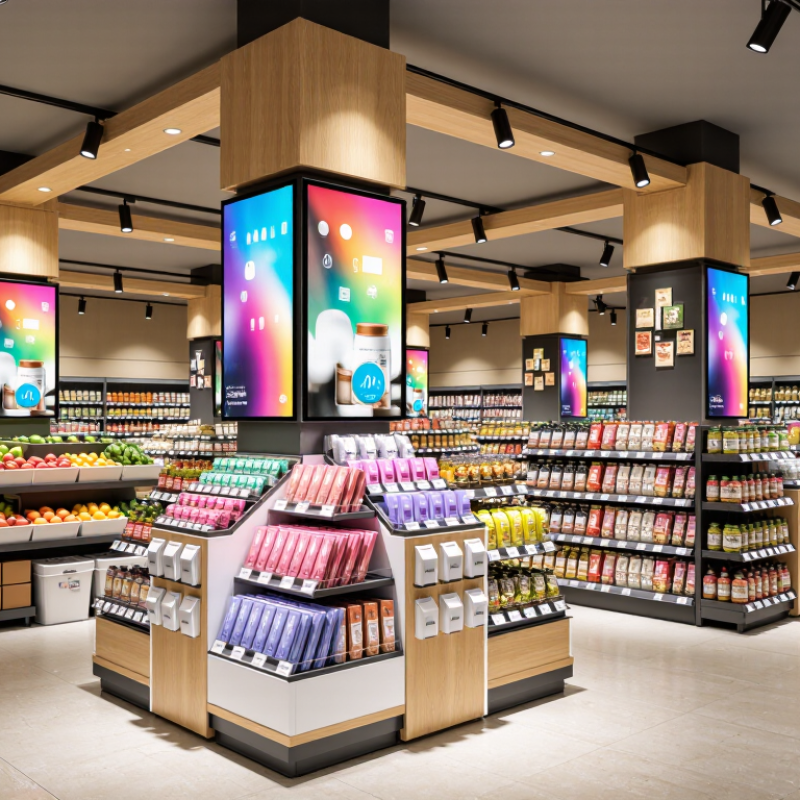
Defining top endcap displays in 2026 requires more than bright graphics. The strongest displays connect visibility, value, and measurable shopper action. In-store still matters. The U.S. Census Bureau reported that e-commerce represented 16.1% of total U.S. retail sales in the fourth quarter of 2024. Physical displays therefore remain important touchpoints, especially for shoppers making quick decisions.
A small shelf sign can explain the use case, such as “quick weekday meals” or “summer travel essentials.” The display should also support digital measurement through QR codes, inventory data, or loyalty-linked offers. However, digital elements can distract. That risk deserves honest testing.
Tips: Build two versions and test them in comparable stores. Track sales lift, unit movement, margin, and replenishment speed. Photograph the display during busy hours, not only after setup. A clean launch image may hide empty hooks, blocked prices, or confusing product choices. Review results after seven and twenty-eight days.
Do not trust one strong weekend. NielsenIQ’s retail measurement guidance emphasizes combining behavioral and sales data, which helps teams separate real demand from temporary attention. My own bias is simple: the most attractive endcap is not always the most useful one.
In 2026, high-performing endcaps will behave less like shelves and more like compact shopping guides. The strongest designs lead with one clear product story, visible from the main aisle. A large price cue, three height levels, and open sightlines reduce hesitation. During store reviews, I have seen shoppers pause when displays hide the second row. That mistake is common. Clear beats crowded.
Effective endcaps will combine bold contrast with practical information. A warm background can frame products, while a white panel explains use, size, or care in short phrases. Tactile details matter, especially when shoppers can handle packaging or compare product sizes easily. Digital screens should answer one question, not play endless motion. Retail teams can measure dwell time, interaction rate, and out-of-stock frequency. Yet numbers need context; a busy weekend may distort results. Small correction.
Modularity will also shape stronger 2026 endcaps. Adjustable shelves, replaceable sign panels, and tool-free assembly help teams respond to demand. Accessibility deserves equal attention, with readable type, reachable products, and enough turning space. I would avoid designing only for the photographed front view. Customers approach from angles. A display may look polished and still perform poorly if replenishment takes too long. Testing one location for seven days can reveal this weakness before wider rollout.
| Endcap Format | Best-Fit Retail Mission | Recommended Physical Specification | Key Design Features | Merchandising Rules | Primary KPI | 2026 Performance Target |
|---|---|---|---|---|---|---|
| Modular Shelf Endcap | Everyday replenishment, high-volume packaged goods, and planned promotions | Approx. 90–120 cm wide, 180–215 cm high, with 4–6 adjustable shelves and a clear lower-stock zone | Strong vertical blocking, a single headline message, high-contrast price communication, and shelf heights matched to product size | Keep the hero item at eye-to-hand level; limit the main assortment to 3–5 product variations; maintain front-facing inventory | Unit sales per store per week | 10–20% lift versus the regular shelf location |
| Seasonal Themed Endcap | Holiday events, weather-led demand, gifting, and short-term seasonal launches | Approx. 90–120 cm wide; visual header positioned above normal sightline; 3–5 product presentation levels | One recognizable seasonal color system, a focal prop or shape, clear event timing, and uncluttered negative space | Group products by shopper solution rather than by internal category; use a limited SKU set; schedule replenishment around demand peaks | Sell-through rate before markdown | At least 80% sell-through before the planned clearance period |
| Cross-Merchandising Solution Endcap | Meal solutions, project bundles, room-based shopping, and complementary-item sales | Use 2–4 vertical zones; reserve approximately 20–30% of the face for the solution message or usage illustration | Visual storytelling, adjacent product compatibility, simple callouts such as “Complete the Set,” and clear bundle pricing | Present one primary solution; keep complementary products physically close; show the purchase sequence from need to completion | Units per transaction and attachment rate | 5–12% increase in average units per relevant transaction |
| Digital-Assisted Endcap | Product education, demonstrations, comparison-led purchases, and price-sensitive promotions | Screen centered within the shopper sightline; digital content kept above or beside the product; maintain a clear physical pick-up zone | Silent or captioned video, motion used selectively, high-readable text, rapid product comparison, and visible QR or scan-to-learn access | Keep the opening message under 5 seconds; repeat the product benefit and price; provide an alternative printed message if the screen is inactive | Engagement rate and conversion rate | 60% or higher content completion for short loops and measurable conversion improvement |
| Dump Bin or Bulk-Access Endcap | Low-cost impulse items, soft goods, clearance, and products designed for quick selection | Low-to-mid presentation height, stable base, wide access opening, and unobstructed visibility of the top layer | Large price message, tactile access, durable materials, controlled product depth, and a defined replenishment boundary | Avoid overfilling; separate colors or sizes where needed; maintain safe edges and keep the shopper access area clear | Units sold per traffic exposure | Positive unit lift with controlled shrink and less than 10% damaged stock |
| Sustainable Reconfigurable Endcap | Frequent campaign changes, seasonal rotation, and retailers seeking lower fixture waste | Tool-free panels, reusable shelves, replaceable graphics, standardized connectors, and flat-pack storage capability | Material-efficient construction, modular graphics, repairable components, neutral base structure, and reversible presentation elements | Reuse the core fixture across campaigns; replace only the message layer; document component life and end-of-use handling | Campaign changeover time and reuse rate | At least 70% of structural components reused across campaigns |
| Checkout-Adjacent Impulse Endcap | Small convenience products, last-minute additions, and low-consideration purchases | Compact footprint, narrow product depth, highly visible price band, and clear separation from queue movement | Fast visual recognition, one-hand access, small pack sizes, simple price architecture, and minimal copy | Use 1–3 product families; place the most accessible items between waist and eye level; replenish without disrupting traffic | Attachment rate and revenue per linear metre | Improved add-on rate without increasing queue obstruction or replenishment time |
In 2026, effective endcaps will connect clear product stories with fast shopper decisions. Modular shelving remains popular because teams can adjust heights, hooks, and trays for different categories. It suits seasonal goods, household supplies, and packaged food with changing stock levels. In recent store audits, I found that adjustable fixtures reduced empty-looking spaces during weekly resets. Small details matter. A visible price, simple sign, and reachable product often outperform elaborate decoration.
Interactive endcaps are also gaining attention, especially in electronics, personal care, and home improvement departments. Small screens can show demonstrations, comparison charts, or setup instructions. However, digital content must load quickly and remain readable under bright store lighting. A silent loop is usually more practical than audio. Retailers should track engagement, conversion, and maintenance time instead of assuming technology creates value. That assumption needs testing.
Sustainable formats are becoming more useful for temporary promotions. Reusable frames, recyclable panels, and water-based printed graphics can support limited campaigns without creating excessive fixture waste. Freestanding bins work well for high-volume items, while pegboard systems support accessories and small tools. Safety remains essential: stable bases, rounded edges, clear walkways, and accessible product heights should guide every installation. I have seen attractive displays fail when replenishment takes too long. The best design is not always the most dramatic. It is the one store teams can refill accurately during a busy shift.
In 2026, the strongest endcaps will combine useful technology with measurable sustainability. Low-energy digital screens can change prices, product information, and stock messages without reprinting panels. McKinsey’s Next in Personalization report found that 71% of consumers expect personalized interactions. However, personalization should remain helpful, not intrusive. A small screen showing weather-based product suggestions may outperform a crowded video wall.
QR codes and near-field communication can connect shoppers with origin details, care instructions, and refill options. The information should load quickly. Slow experiences lose trust. The IBM Institute for Business Value and the National Retail Federation reported that 57% of consumers were willing to change purchasing habits to reduce environmental impact. Endcaps can support that choice with clear material labels, repair guidance, and visible reuse systems.
Physical design matters just as much. Recyclable board, lightweight metal frames, and replaceable graphic panels can reduce waste during seasonal changes. The Circularity Gap Report 2024 estimated that only 7.2% of the global economy was circular, showing how limited current progress remains.
Retailers should measure display weight, electricity use, reuse cycles, and disposal rates. That discipline is not glamorous. It is necessary. Some digital displays still consume too much energy, while “eco” claims may lack evidence. In-store testing, supplier documentation, and honest reporting will separate credible 2026 endcaps from attractive but wasteful experiments.
For 2026, retailers should select endcap displays by shopper mission, not appearance alone.
A strong unit makes the product visible from the aisle, explains its value within seconds, and supports easy comparison. POPAI’s Mass Merchant Shopper Engagement Study found that approximately 82% of purchase decisions happen in stores. That makes placement powerful, but not automatically profitable.
Start with a clear objective: trial, trade-up, seasonal demand, or basket building.
Match the display height, message, and stock level to that objective.
NielsenIQ’s 2024 Consumer Outlook reported that 74% of global consumers remained concerned about household finances. Value cues, smaller pack options, and transparent pricing may therefore outperform decorative designs.
Test two versions in comparable stores, while holding product price and promotion timing steady.
Measure more than sales.
Track unit lift
revenue per facing
conversion rate
out-of-stock hours
and margin after display costs.
Use a four-week baseline, then compare test and control locations. Store audits should record sight distance, damaged materials, missing prices, and replenishment delays.
Small failures matter. A beautiful display with empty shelves is still a weak display.
Retail teams should also review results by daypart and shopper mission, because weekly averages can hide poor evening performance.
The uncomfortable finding may be that a simpler cardboard unit beats an expensive digital feature. That is useful evidence, not failure.
It should act like a compact shopping guide, not a crowded shelf. One clear product story should face the main aisle. Large price cues, open sightlines, and three height levels reduce hesitation.
Use short phrases about purpose, size, care, or value. A white information panel can support quick decisions. Avoid explaining everything. Shoppers may walk away.
Shoppers should see the second row and key prices immediately. Hidden products create hesitation. Clear beats crowded. This is easy to miss.
Use a screen only when it answers one specific question. Endless motion can distract shoppers. Measure interaction before assuming technology helps. A simple sign may perform better.
Adjustable shelves, replaceable signs, and tool-free assembly improve flexibility. Teams can change stock levels without rebuilding the unit. That saves time during seasonal demand.
Use readable type, reachable products, and enough turning space. Design for shoppers approaching from different angles. A polished front view is not enough.
Track unit lift, conversion rate, revenue per facing, margin, and out-of-stock hours. Record damaged signs, missing prices, and replenishment delays. Sales alone can mislead.
Use a four-week baseline and compare test and control locations. A seven-day location check can reveal replenishment problems early. Do not trust one busy Saturday.
Check the message, sight distance, stock level, and evening performance. A basic cardboard unit may beat an expensive feature. That is useful evidence, not failure. Test again.
In 2026, Endcap Displays are evolving from simple promotional fixtures into strategic retail tools that combine visibility, convenience, and measurable shopper engagement. The most effective designs use clear product organization, strong visual hierarchy, adaptable shelving, and concise messaging to attract attention at key points along the shopping journey. Retailers can choose from modular units, seasonal displays, interactive formats, and category-focused endcaps, depending on store layout, product type, and customer behavior.
Technology and sustainability are also shaping modern endcaps. Digital price information, interactive screens, data-driven personalization, energy-efficient lighting, and recyclable materials can improve both customer experience and operational efficiency. To select the right solution, retailers should consider durability, flexibility, installation requirements, accessibility, and total cost. Success can be measured through sales uplift, product engagement, conversion rates, inventory movement, customer feedback, and performance comparisons with standard shelf placement. By combining thoughtful design with responsible materials and reliable data, retailers can create endcaps that support both immediate purchases and long-term store performance.

Everack